
Photo by Juan Cruz Mountford on Unsplash
This is part 2 in a series. If you’re not yet convinced that “it’s not only who we know, it’s who they know”, you may want to check out part 1 first. Also, I try to avoid using technical terms in these articles. At the end of this one I provide a list of commonly used words if you’re interested in “going down the rabbit hole”.
Once we internalise the fact that who we know matters, we can start to imagine that who they know also matters. We are shaped by all the connections that the people we know (and don’t know) have with each other, not just our individual connections.
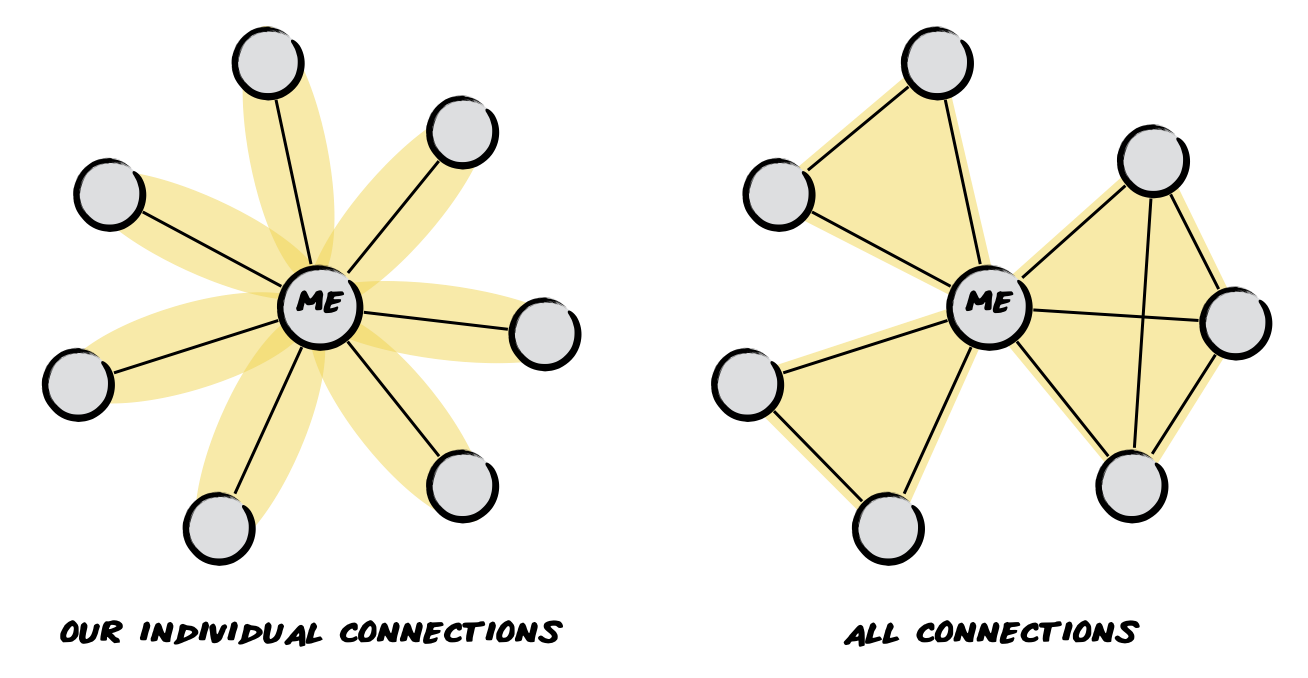
These connections are what gives a community its shape. Without them, everyone’s would look the same, where we are at the centre and all of the people we interact with sit around us. However, we know that these people have independent relationships with each other. All those connections, not just our individual connections, influence outcomes for the people and communities we care about.
Who they know influences our health
Nicholas Christakis is a professor at Yale University and Director of the Human Nature Lab. In Connected: The Surprising Power of Our Social Networks and How They Shape Our Lives, he summarises how who-knows-who influences our thoughts, feelings, and behaviours. In one study, they were able to show that if a person’s friend’s friend’s friend was obese, it increased the likelihood that person was also obese. That means that we are influenced by many people we have never met and may never meet.
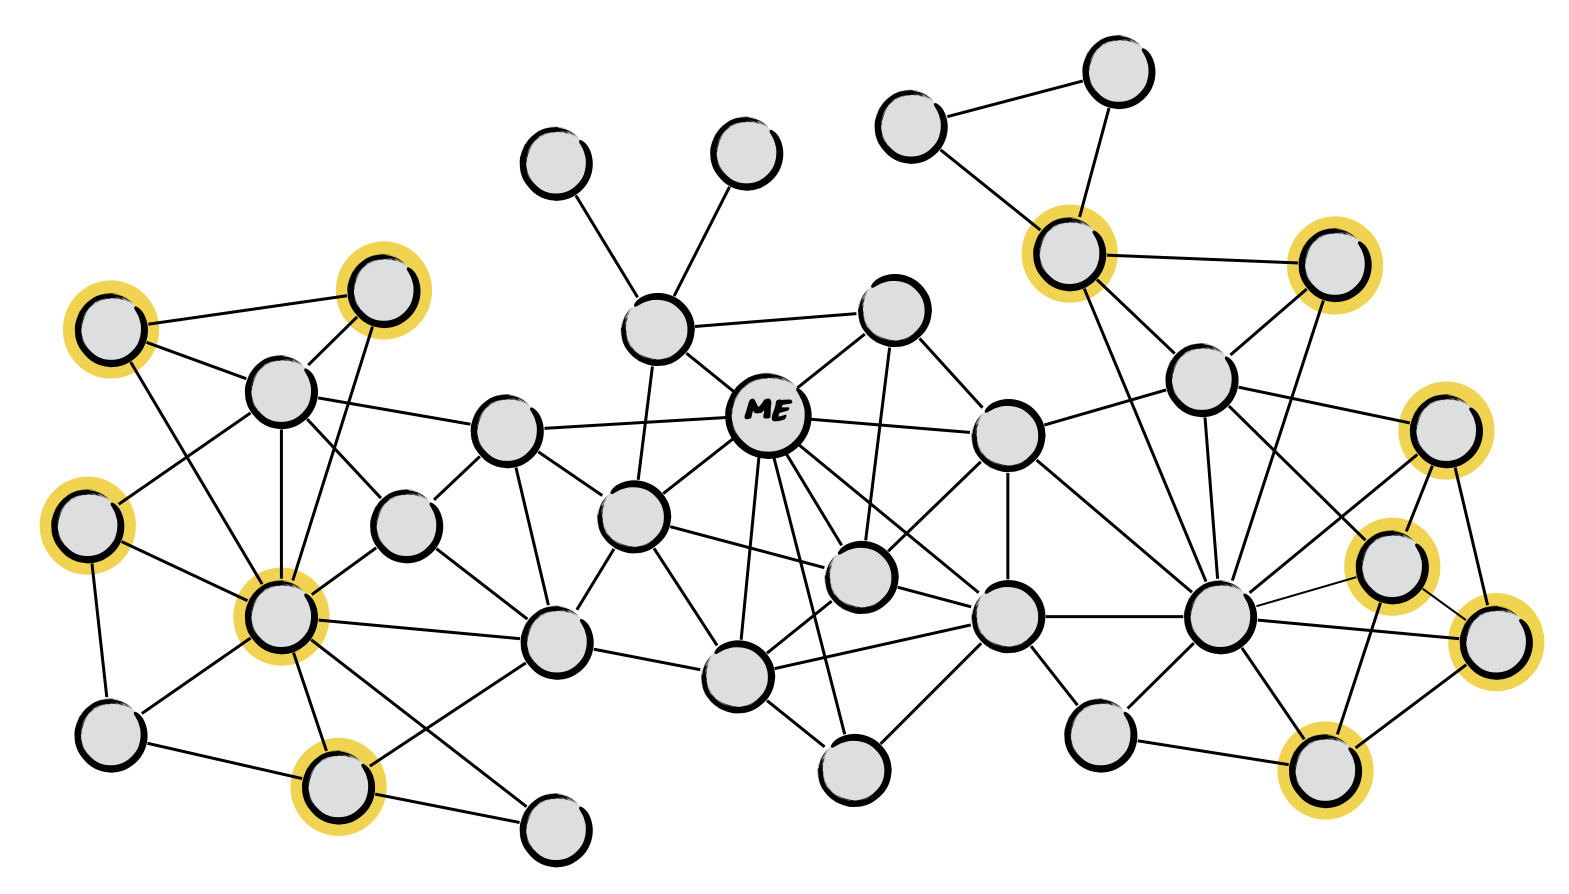
Imagine you’re at the centre of this community above and know 8 people. Not only are you influenced by the 8 people you know and the 8 people they know, but you are also influenced by the 11 people that those people know (highlighted in yellow). The habits and behaviours of those 27 people will each have some influence over what you do.
Amar Dhand is a neurologist at Brigham and Women’s Hospital and a social scientist at Harvard Medical School. In “Social Networks and Risk of Delayed Hospital Arrival After Acute Stroke“, he describes how the connections between people they know directly impact their health. He found that the shape of the group could significantly delay a patient’s arrival at the hospital after experiencing stroke symptoms. This is important because there are treatments that are only effective within certain time windows and 70% of stroke patients don’t arrive in time to take advantage of them.
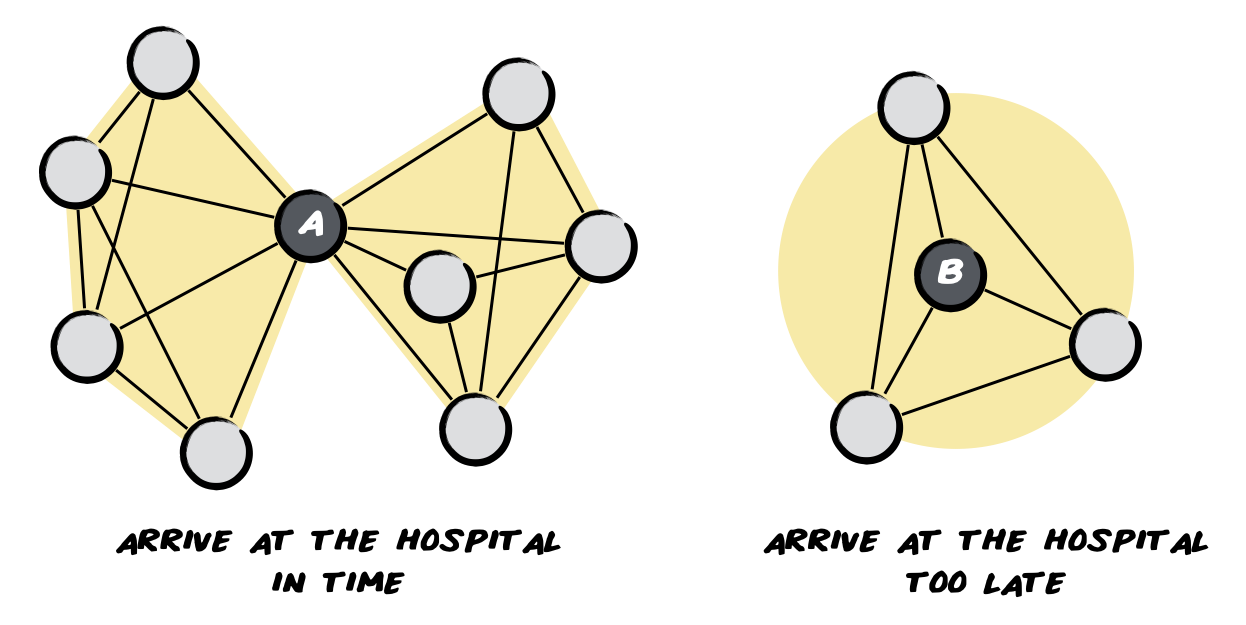
He found that people in small, strong, tight-knit groups consistently arrived late to the hospital, therefore missing this window for valuable stroke treatments. On the other hand, people with weaker ties and less interconnected groups were more likely to arrive in time. Friends and family of patients in small, strong, tight-knit groups were more likely to discuss the situation at length, debate options, and often decided to adopt a ‘watch and wait’ approach. This unhelpful behaviour delayed a trip to the hospital and access to timely treatment.
Who they know influences our success
You’ve probably heard me talk about Janice McCabe’s work because the insights are so clear and powerful. She is an associate professor of sociology at Dartmouth College and author of Connecting in College: How Friendship Networks Matter for Academic and Social Success. When Dr. McCabe drew the friend groups of a student from their perspective, she identified three different shapes. These drawings show a group from the point of view of the individual at the centre. She studied students at a large, US university and found that one shape could significantly help or hurt students’ academic success. She also found that this shape was more common among specific groups of students.
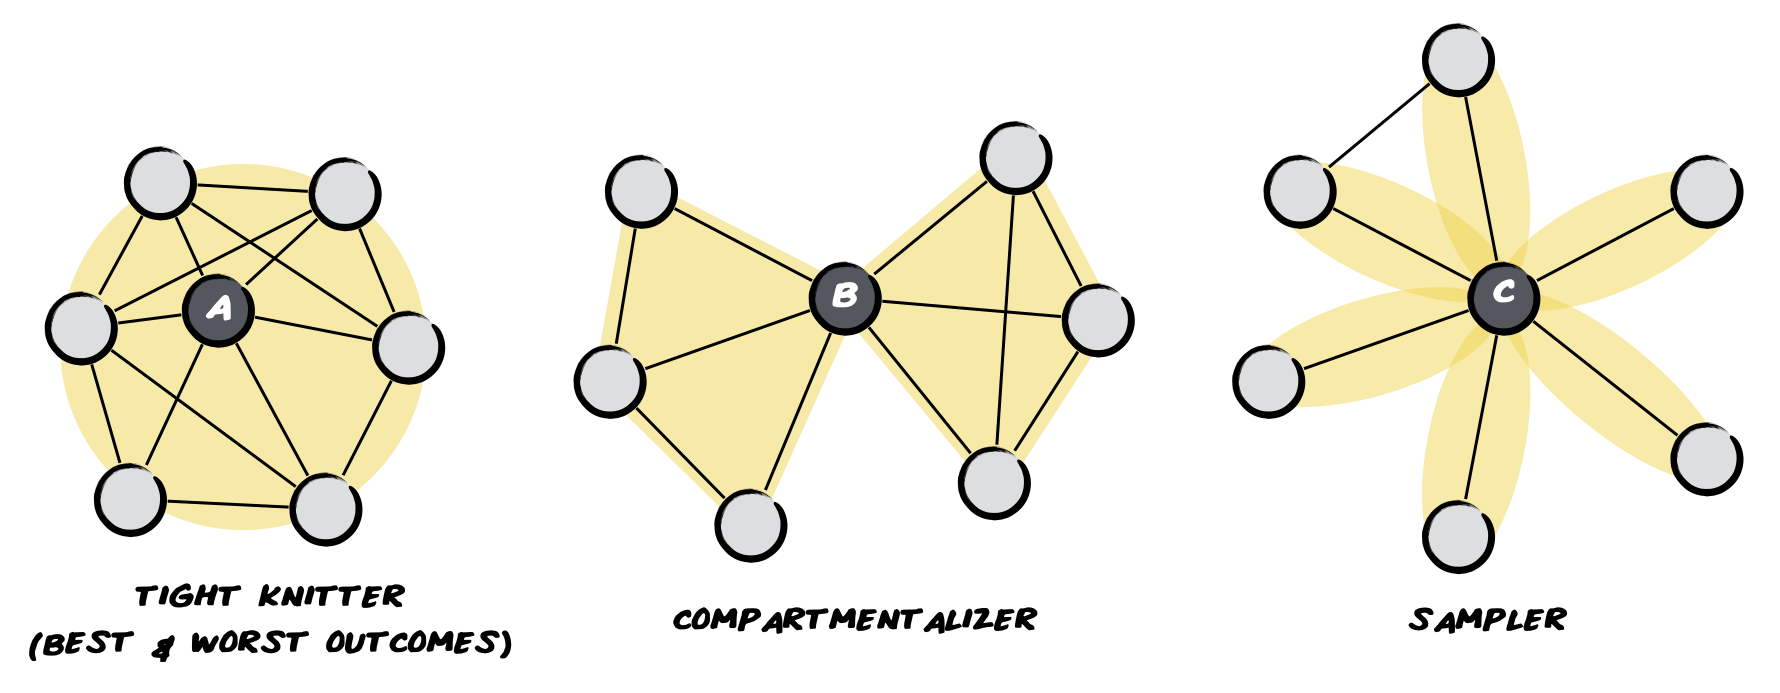
These are the three shapes she identified. Tight-knitters look like a ball of yarn, where most of the people in the group know each other. Compartmentalizers look like a bow tie, where there are two or more groups of friends, but those groups don’t know each other. Samplers look like a daisy, where the person has several one-to-one friendships, but most of those people don’t know each other. Isn’t it interesting how the tight-knit ball of yarn and the bow tie-shaped compartments show up in both Dhand and McCabe’s work?
Tight-knit groups drove significantly better outcomes when friends supported each other academically. However, if friends discouraged or undermined the academic efforts of the student, it resulted in worse academic outcomes. In her study, only 77% of tight-knitters graduated, compared with 91% of compartmentalizers and 92% of samplers. Unfortunately, students from underrepresented ethnicities were significantly more likely to have tight-knitter friend groups. The qualitative interviews uncovered two reasons for this. First, there were far fewer people on campus with the same ethnic background, so they tended to band together. Second, they reported that their close-knit friend groups helped them deal with the inequality and structural racism they experienced.
In school, I didn’t have one tight-knit group of friends that I always hung out with. I had a handful of very close friends, each of whom was part of a different social group. It was great for trying on different identities. It was bad for securing Friday night plans. As an adult, I have cultivated intellectually-stimulating connections with people all over the world. My personal network is an information and idea gathering machine, where I connect infrequently with many people who don’t know each other. Each would introduce me to something new and provide a unique perspective. It’s invaluable for my career and personal growth, but less helpful for my habit of locking myself out.
These ideas also apply in professional contexts. The tagline of this Harvard Business Review article says it all: “Measure who they know, not just who they are”. Paul Leonardi, Noshir Contractor, and their collaborators have identified signature shapes that correlate with important business activities in an organisation such as ideation, influence, efficiency, and innovation.
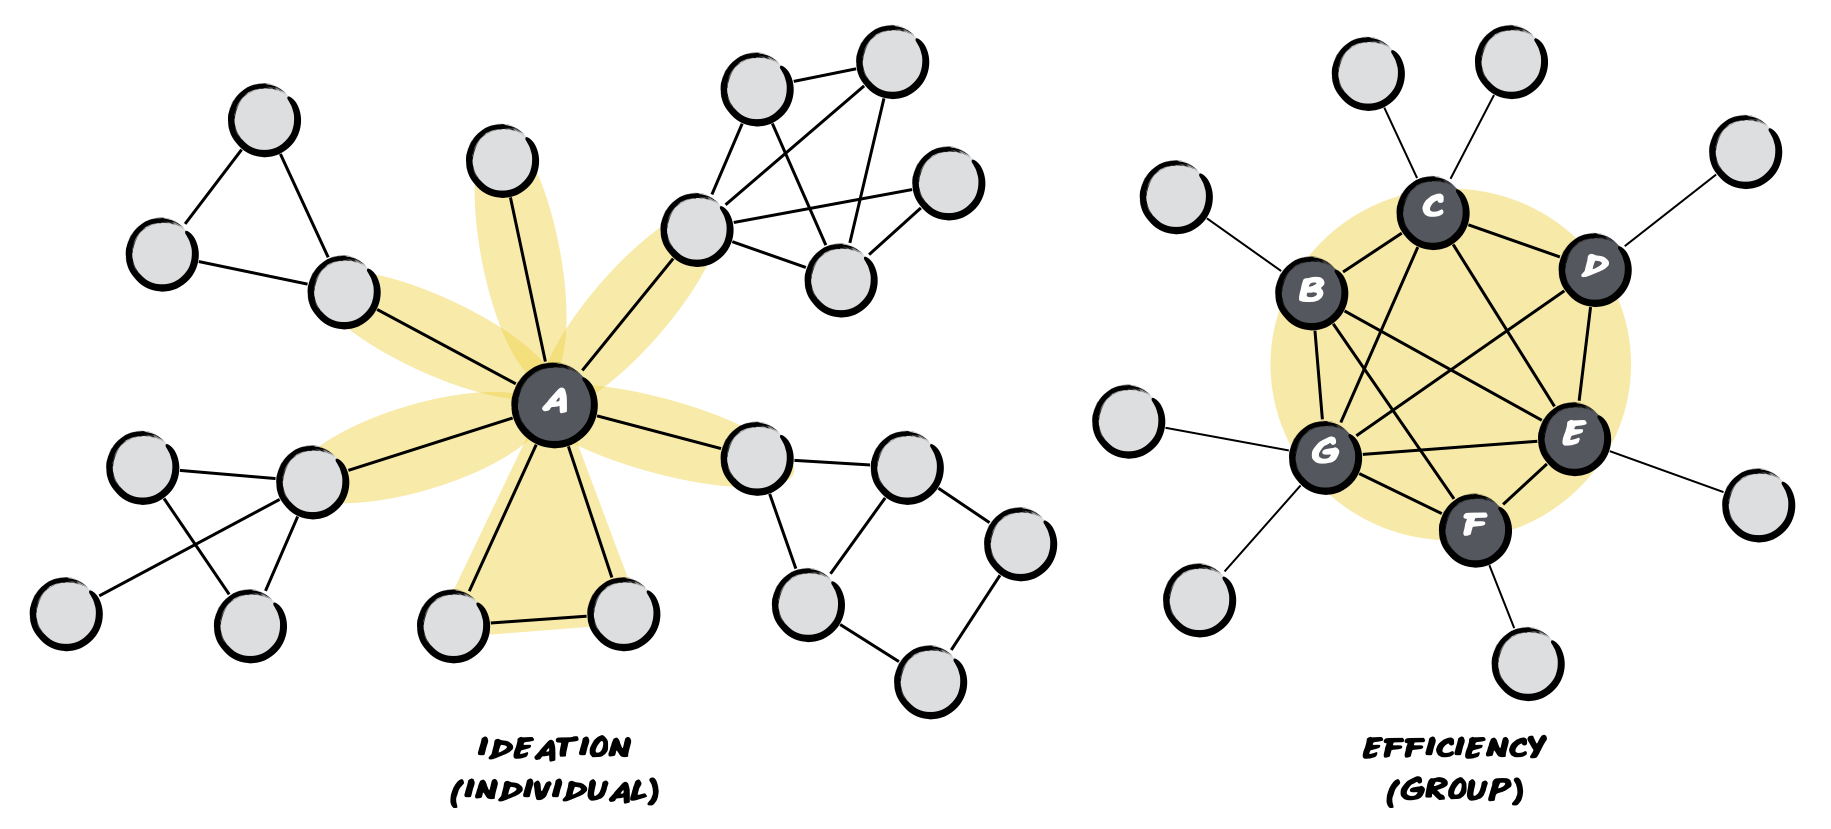
Again, we see the daisy and ball of yarn shapes. It’s not surprising that a person “sampling” from the organisation would be more likely to generate new ideas. They are a hub between many different groups and can spot patterns that other people may not be able to see. It’s also reasonable to expect that a tight-knit group would be more efficient. They are continuously improving how they work together. The challenge is that it is hard to be both at the same time, which is an example of the classic trade-off between exploration and exploitation.
Who they know influences how information and behaviour spreads
First, let’s think about the difference between spreading information and behaviour. In the case of information, a person only needs to hear from someone once about a job opportunity in order to spread that information further. In the case of behaviour, people often need to see two or more others adopting a behaviour before they are willing to adopt it themselves.
Damon Centola is a professor at the University of Pennsylvania and author of How Behavior Spreads: The Science of Complex Contagions. He has studied the spread of information and behaviour within networks and found that the shape impacted how successfully behaviours spread, if at all.
In a set of experiments, Centola took three different hypothetical shapes and timed how long it took for information or behaviour to spread to every member of that community. The first one had all wide bridges, meaning that people in the group always had mutual connections. The second one had a mix of wide and narrow bridges. The third one had almost all narrow bridges, meaning that the people in the group didn’t have mutual connections.
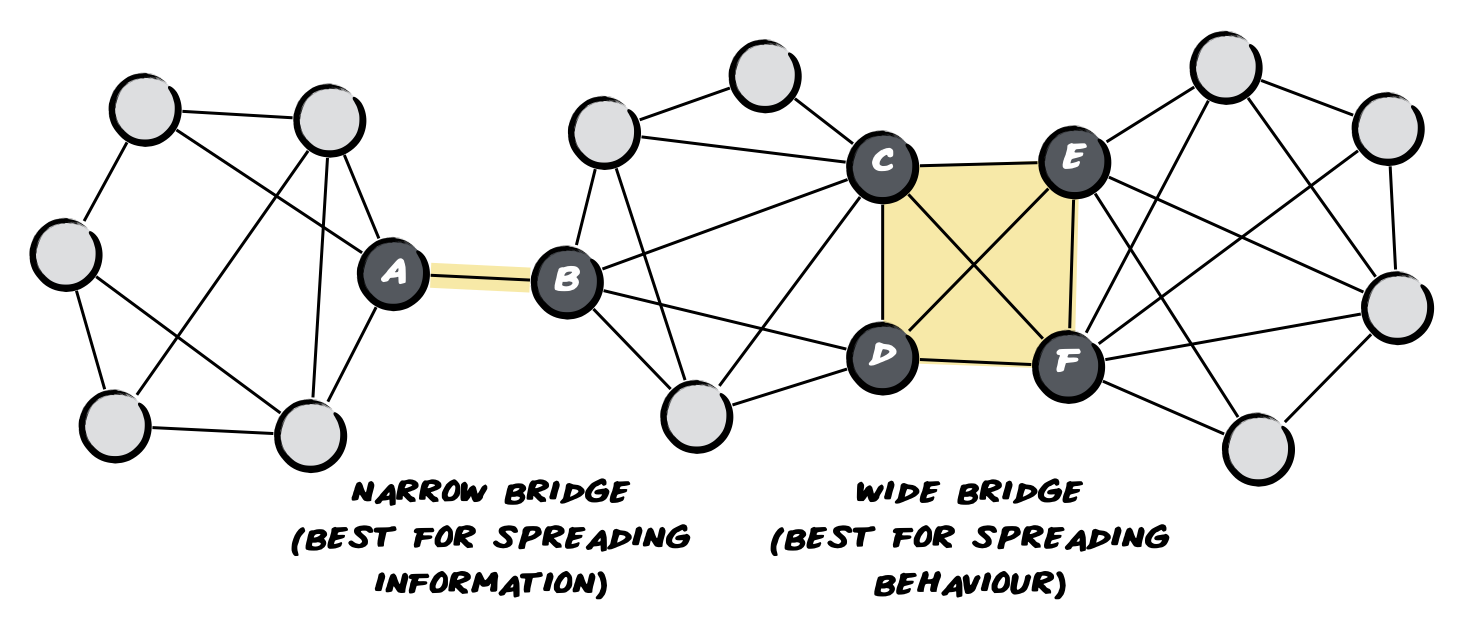
Information took fourteen days to spread in a wide-bridge group and only three days to spread in a narrow-bridge group. In contrast, behaviour took 26 days to spread in a wide-bridge group and 35 days to spread in a mixed-bridge group. Behaviour was unable to spread even after 100 days in a narrow-bridge group.
He concluded that new behaviours spread most effectively over wide bridges because individuals need social reinforcement to adopt them. While one weak relationship between two tight-knit groups is often sufficient to spread information or disease, behaviour struggles to travel across such a narrow bridge. The key insight here is that a community that is very effective at spreading disease may not be as successful at spreading the behaviours necessary to mitigate the impact.
Map your community
Now that we understand why who they know matters, we can actually do something about it. Ready to reflect on the community surrounding you? In the next article, explain how to Map Your Community in Minutes. It doesn’t take a lot of time or require any fancy tools. While there’s no such thing as perfect, it will provide some insights about how the people we spend time with influence our lives.
A note on language
In my experience, the language used to describe this type of visualisation varies by discipline. Data scientists, physicists, and sociologists don’t use the same terminology and the words are often opaque. My hope is to make this type of research accessible to a wider audience.
- Map – most of the time this is called a graph, but if they are displaying the network around one individual they can sometimes be referred to as a sociogram or egonet
- People/Circle – most commonly referred to as a node or vertex and can represent people, organisations, or even pieces of information
- Connection/Line – can be called an edge or tie and represents a relationship between two nodes
- Shape – often described as the structure of the graph with reference to it’s density and how the nodes are clustered