This is the 3rd post in a series. If you’re not familiar with how to read network graphs, you might prefer to start with Concept 1 or Concept 2.
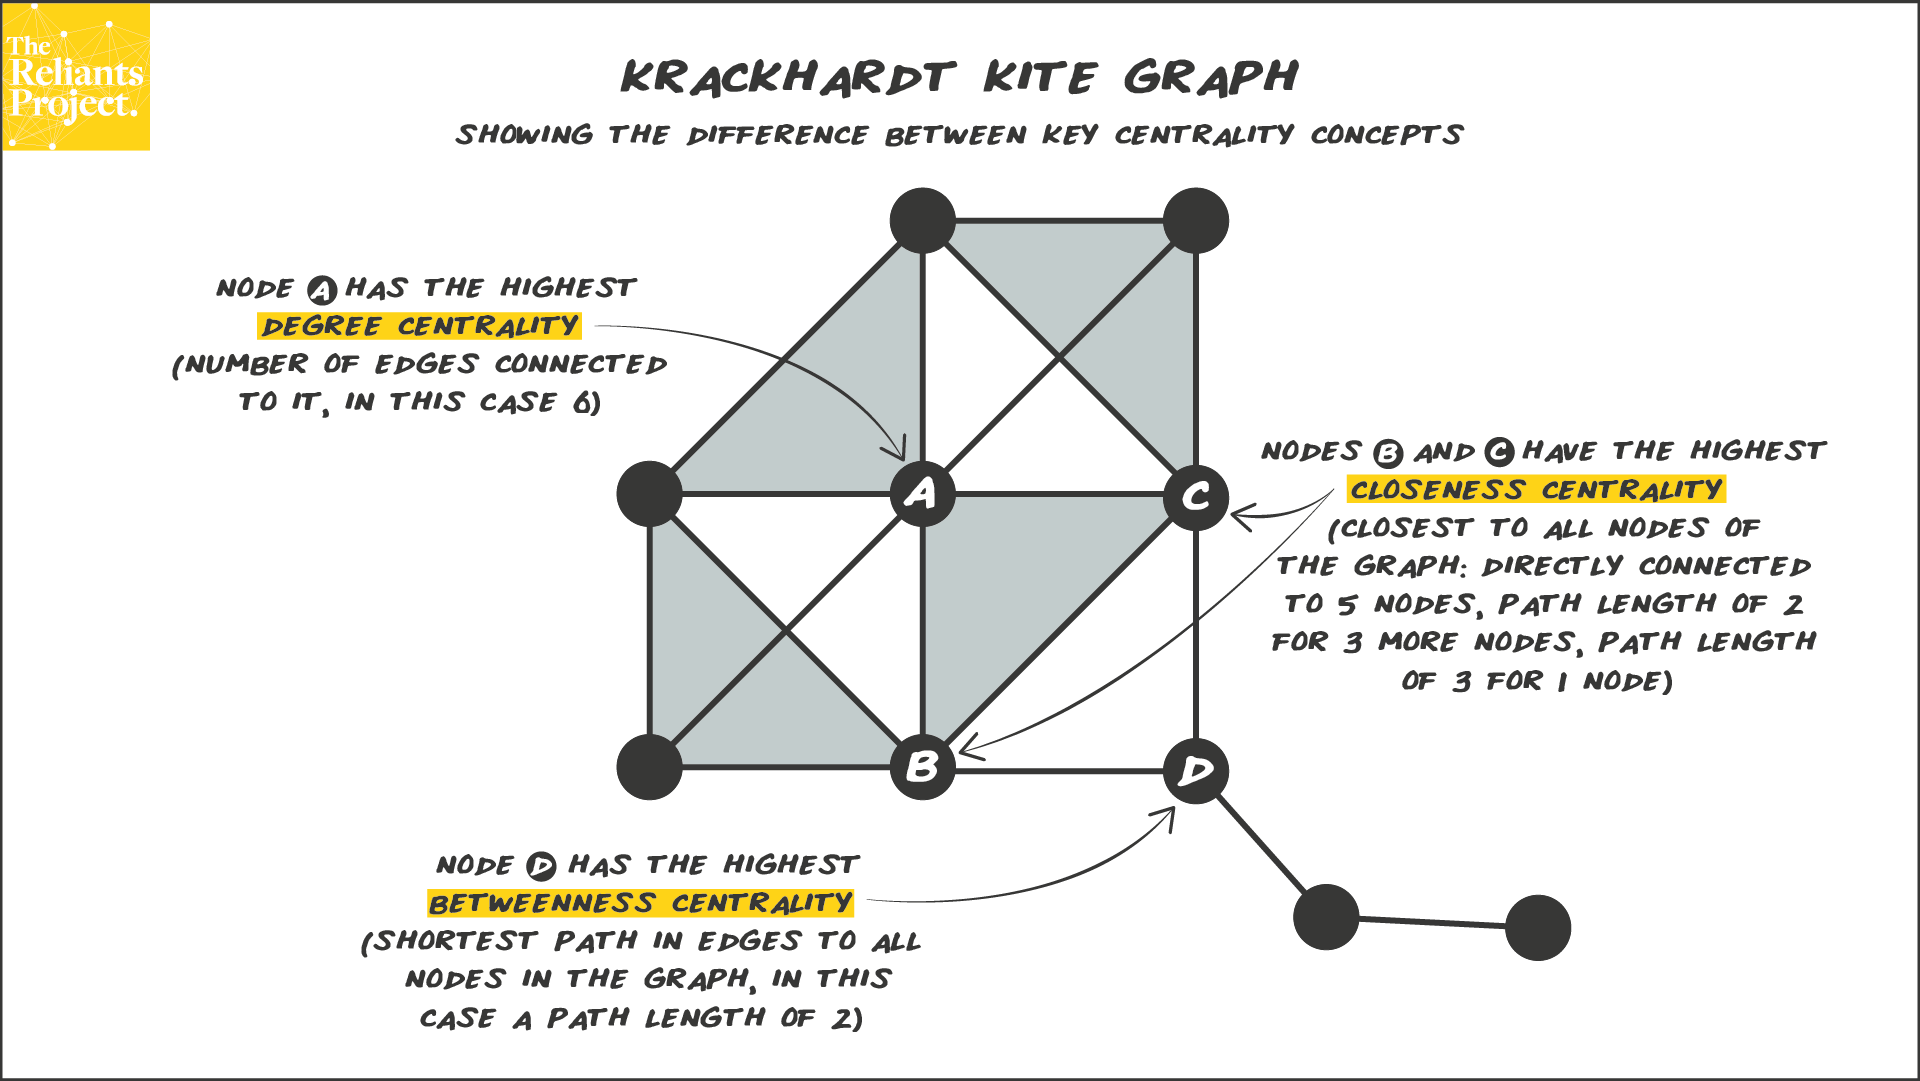
Above and beyond reading the basic information shown in a graph, there are common metrics that people can measure to better understand a network. One of the most useful is centrality. This is a measure for each node in a graph to compare how central that node is to all the other nodes in the same graph. These metrics are often a proxy for importance in a network. Today there are many different centrality metrics based on the specific nuance you wish to measure. Krackhardt uses the image of a kite to help us remember the 3 most common types:
- Degree Centrality: quantity of edges connected directly to a node (A has the most edges in comparison to all the other nodes in this graph)
- Closeness Centrality: shortness of path from one node to all other nodes (B and C are closer to the tail of the kite than A, so their closeness centrality is higher)
- Betweenness Centrality: closeness of a node to each of the other nodes (D is even closer to the tail of the kite than A, B or C, so it’s betweenness centrality is higher)
This helps us appreciate that the node with the highest degree centrality isn’t always in the most central and therefore most important in a network.
Ready for the next concept? The next one in the series is Concept 4: Job Opportunities and Granovetter’s Strength of Weak Ties.